


In today's highly competitive business environment, organizations are constantly striving for operational excellence. One of the most effective methodologies to achieve this is Six Sigma. Among its various levels, the Yellow Belt is an essential stepping stone for anyone looking to understand the basics of this powerful process improvement tool. In this blog, we will explore key Six Sigma Yellow Belt tools, including the DMAIC methodology, SIPOC diagrams, Pareto analysis, and the Fishbone diagram. By the end, you'll have a solid understanding of how these tools can enhance your organization’s efficiency and effectiveness.
Understanding Six Sigma and the Role of Yellow Belts
Six Sigma is a data-driven approach aimed at reducing defects and improving processes within an organization. It employs various tools and techniques to identify and eliminate root causes of problems. The Yellow Belt level is often the starting point for individuals new to Six Sigma. Yellow Belts are typically team members who assist with process improvement projects and help with data collection and analysis.
As a Yellow Belt, having a firm grasp of key Six Sigma tools is crucial for contributing effectively to your team's success. Let’s dive into the specific tools that every Yellow Belt should be familiar with.
DMAIC Methodology
What is DMAIC?
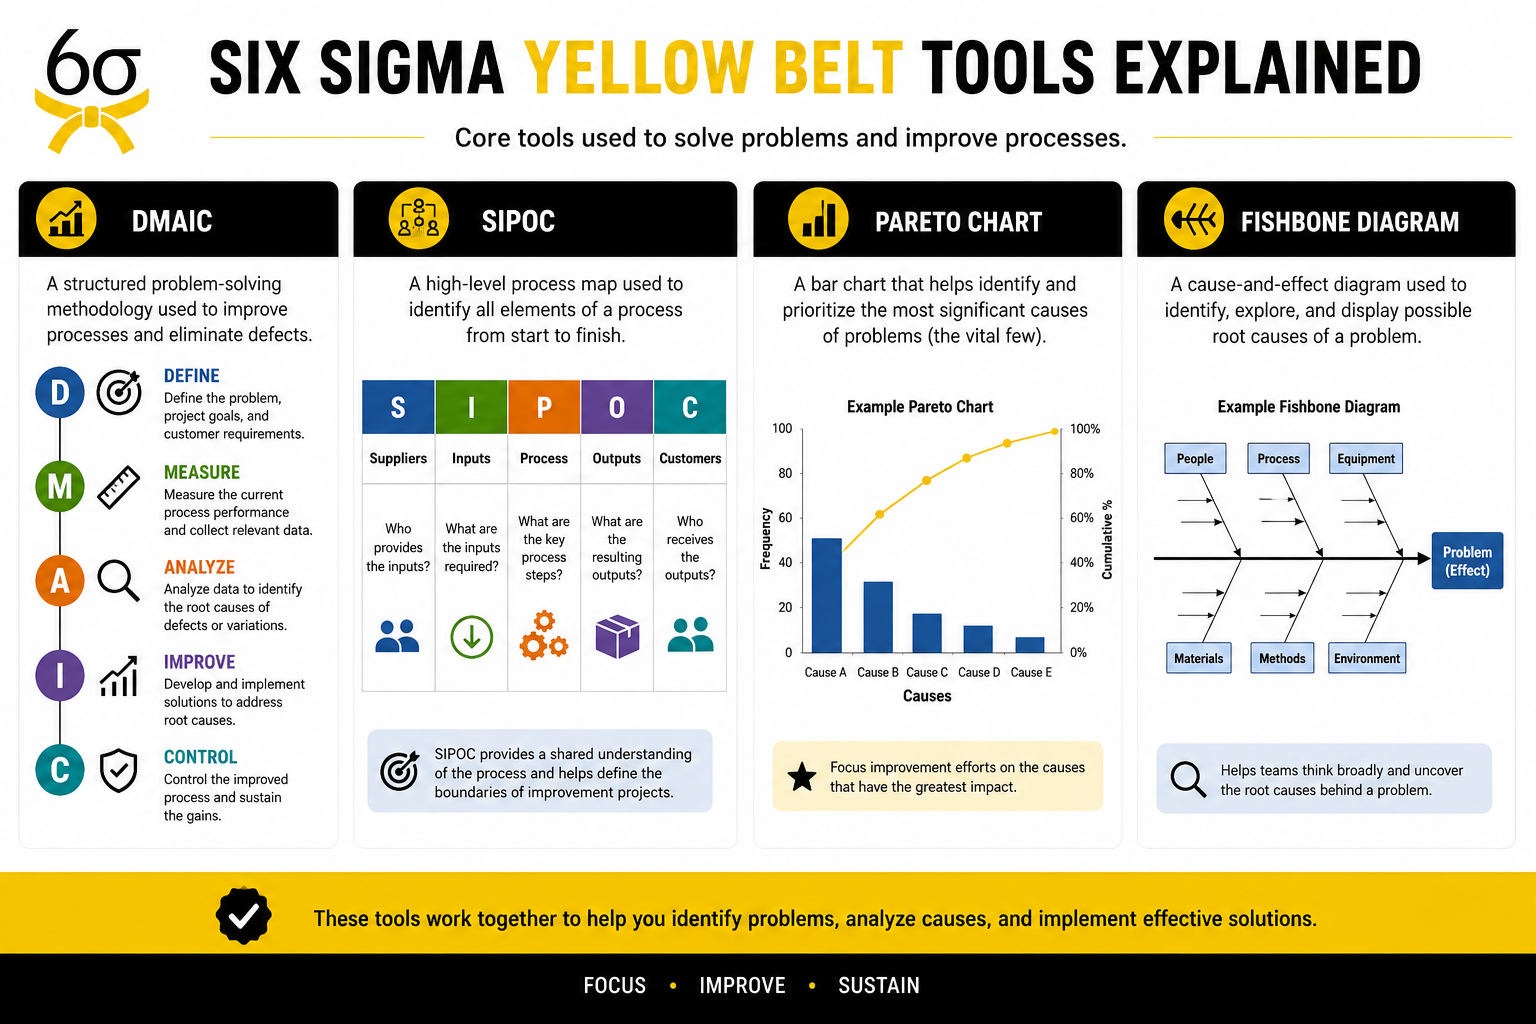
DMAIC stands for Define, Measure, Analyze, Improve, and Control. It is a structured problem-solving methodology widely used in Six Sigma projects. Each phase of DMAIC plays a crucial role in achieving process improvement and operational excellence.
1. Define Phase
The first step is to identify the problem and define the project goals. This involves understanding customer requirements and expectations. Tools like project charters and problem statements are often used in this phase.
2. Measure Phase
In this phase, you collect data to establish a baseline for current performance. This may involve gathering quantitative and qualitative data. Key performance indicators (KPIs) are defined to measure progress effectively.
3. Analyze Phase
The Analyze phase focuses on identifying root causes of the problems identified in the Define phase. Statistical analysis tools, such as control charts and histograms, can help visualize data and uncover patterns.
4. Improve Phase
During the Improve phase, potential solutions are developed and tested. This may involve brainstorming sessions and pilot testing to evaluate the effectiveness of proposed changes.
5. Control Phase
The final phase of DMAIC involves establishing controls to sustain improvements. This includes creating monitoring systems and standard operating procedures to ensure the changes are maintained over time.
SIPOC Diagram
What is SIPOC?
SIPOC is an acronym for Suppliers, Inputs, Process, Outputs, and Customers. This tool provides a high-level overview of a process and is instrumental in the Define phase of the DMAIC methodology.
How to Create a SIPOC Diagram
To create a SIPOC diagram, follow these steps:
A SIPOC diagram helps teams visualize the entire process and ensures everyone understands their role within it. This tool is particularly useful for Yellow Belts as it simplifies complex processes into manageable components.
Pareto Analysis
What is Pareto Analysis?
Pareto Analysis is based on the Pareto Principle, which states that 80% of effects come from 20% of causes. This tool helps prioritize problems based on their impact, allowing teams to focus their efforts on the most significant issues first.
How to Conduct a Pareto Analysis
To perform a Pareto analysis:
By focusing on these critical problems, Yellow Belts can drive significant improvements in their processes.
Fishbone Diagram
What is a Fishbone Diagram?
Also known as the Ishikawa diagram or cause-and-effect diagram, the Fishbone diagram is a visual tool used to identify and categorize potential causes of a specific problem. It helps teams organize thoughts and brainstorm solutions effectively.
How to Create a Fishbone Diagram
To create a Fishbone diagram:
This tool enhances team collaboration and ensures that all potential root causes are considered before moving forward with solutions.
Why Are These Tools Important for Yellow Belts?
Understanding and utilizing Six Sigma Yellow Belt tools like DMAIC, SIPOC, Pareto analysis, and the Fishbone diagram can significantly enhance a Yellow Belt’s effectiveness within a team. These tools aid in:
By mastering these tools, Yellow Belts can contribute more effectively to their organization’s continuous improvement initiatives.
FAQs
1. What is the primary role of a Six Sigma Yellow Belt?
The primary role of a Six Sigma Yellow Belt is to support process improvement projects by assisting with data collection, analysis, and implementation of solutions.
2. How long does it take to become a Six Sigma Yellow Belt?
The duration to become a Six Sigma Yellow Belt varies, but typically, training programs last between 2 to 5 days, followed by a certification exam.
3. Can I use these tools outside of Six Sigma projects?
Yes, Six Sigma tools like DMAIC, SIPOC, Pareto analysis, and the Fishbone diagram can be applied in various fields to enhance process efficiency and problem-solving capabilities.
Conclusion
Six Sigma Yellow Belt tools such as DMAIC, SIPOC, Pareto analysis, and the Fishbone diagram are indispensable for anyone interested in process improvement. By mastering these tools, you can play a crucial role in enhancing your organization's operational performance. Whether you're just starting your Six Sigma journey or looking to deepen your understanding, these tools will empower you to make data-driven decisions and contribute to a culture of continuous improvement.
If you’re ready to take your understanding of Six Sigma to the next level, consider enrolling in a Six Sigma Yellow Belt training program today. Equip yourself with the knowledge to drive impactful change in your organization!